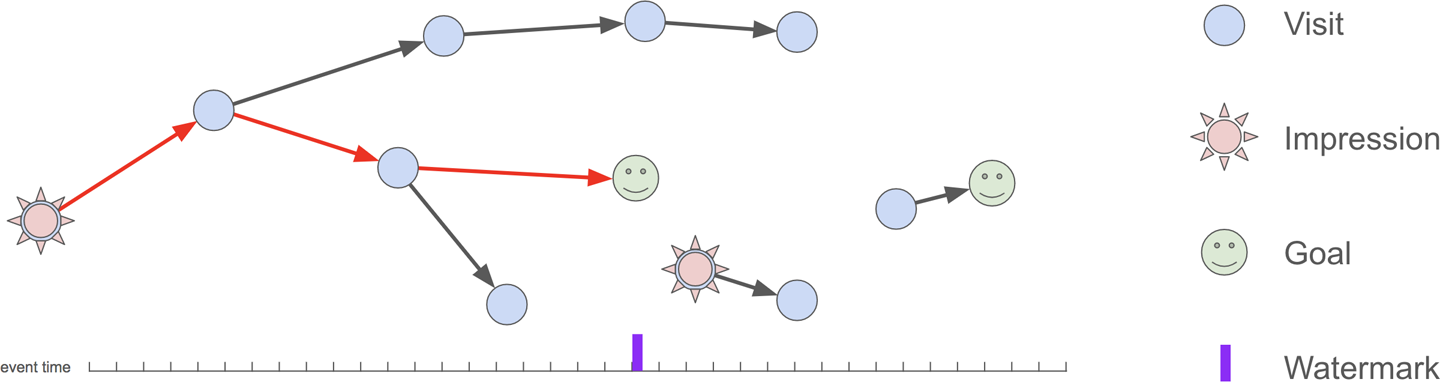
Figure 7-3: Example conversion attribution. In this diagram, a user’s traversal of various pages on a website is represented as a graph. Impressions are advertisements that were shown to the user and clicked, resulting in the user visiting a page on the site. Visits represent a single page viewed on the site. Goals are specific visited pages that have been identified as a desired destination for users (e.g., completing a purchase, or signing up for a mailing list). The goal of conversion attribution is to identify ad impressions that resulted in the user achieving some goal on the site. In this figure, there is one such conversion highlighted in red. Note that events might arrive out of order, hence the event-time axis in the diagram and the watermark reference point indicating the time up to which input is believed to be correct.