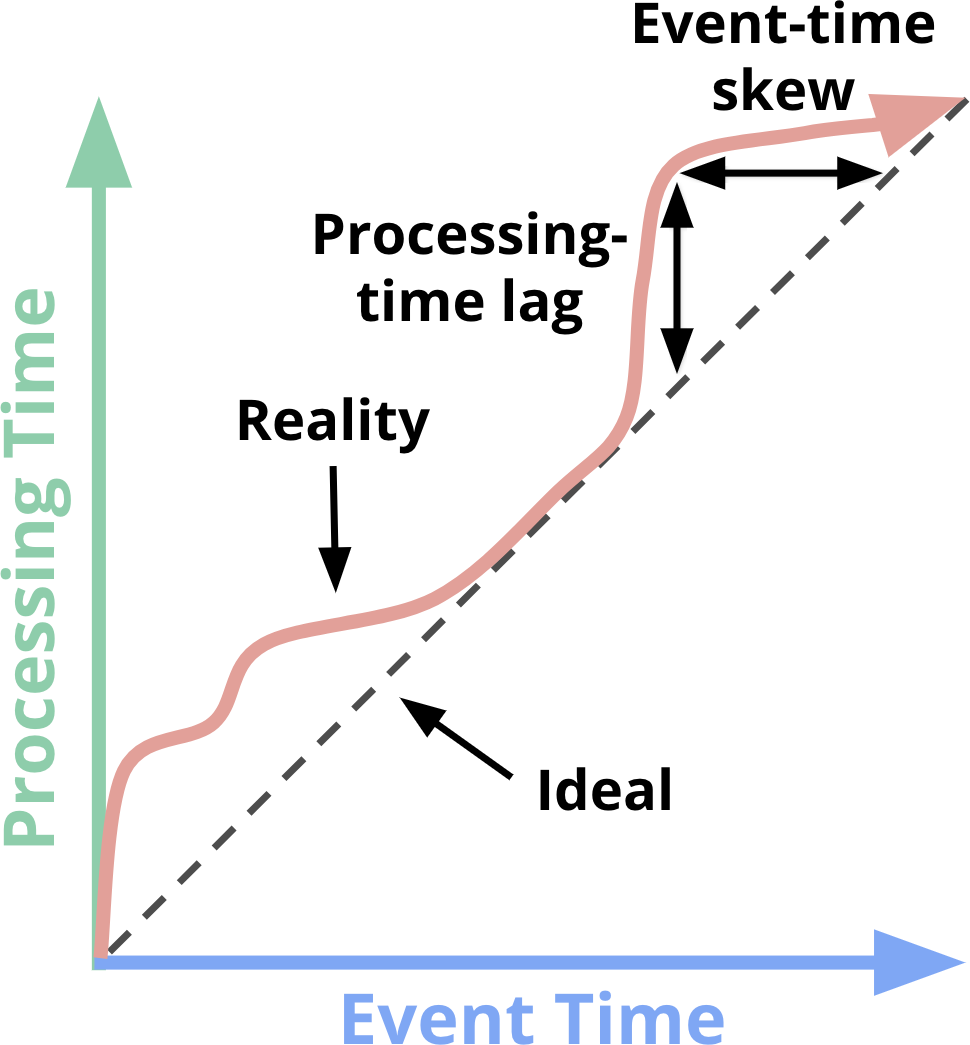
Figure 1-1: Time-domain mapping. The X axis represents event-time completeness in the system; that is, the time X in event time up to which all data with event times less than X have been observed. The Y axis represents the progress of processing time; that is, normal clock time as observed by the data processing system as it executes.